

Dynatrace integration for Gatling
Send load test metrics to Dynatrace and set custom test headers on all generated requests.
Gatling Enterprise Edition Integration
Introduction
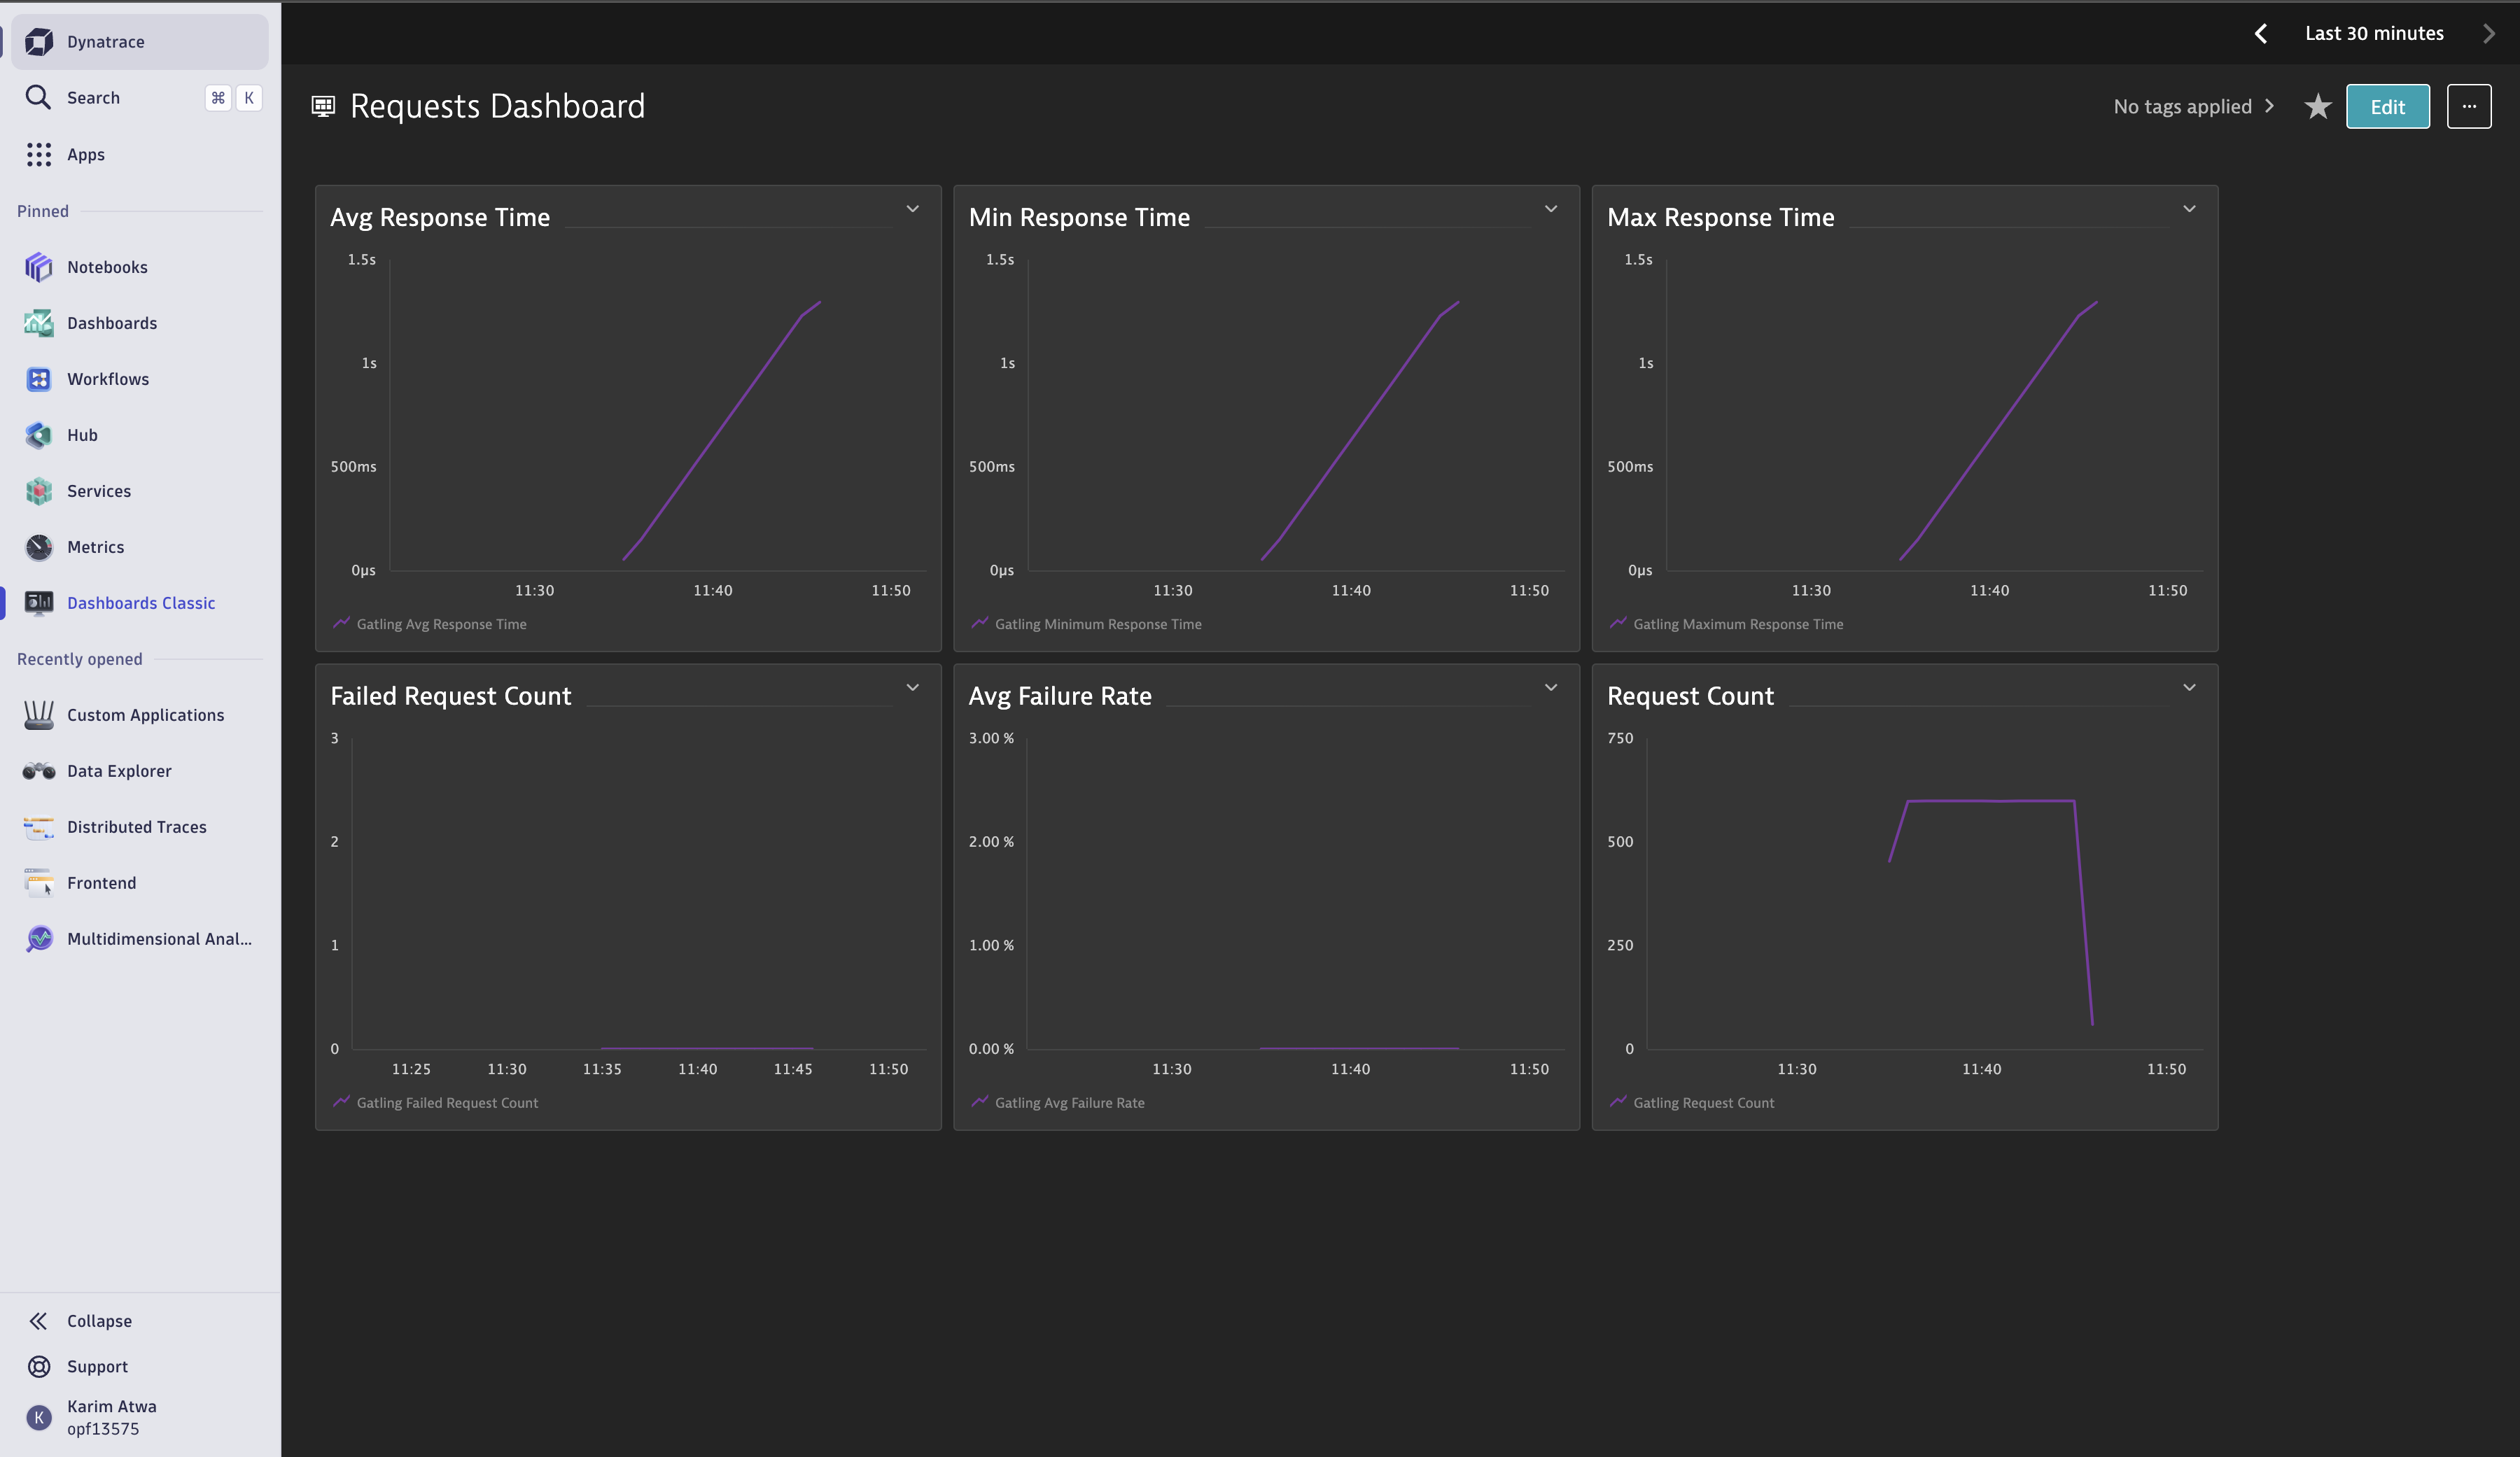
The Dynatrace integration allows Gatling Enterprise Edition to send load-test metrics - such as response times, throughput, and error rates - directly into Dynatrace’s observability platform. Once enabled, performance data from Gatling Enterprise Edition is sent to Dynatrace, where it can be correlated with infrastructure and application metrics already collected in your Dynatrace account.
With this integration in place, you can:
- Monitor Gatling scenarios alongside server-level KPIs (CPU, memory, network) in a single dashboard.
- Investigate performance issues more effectively by overlaying load-test metrics on traces, logs, and resource utilization charts.
Prerequisites
- A valid Dynatrace API key
- Your Dynatrace site identifier
- A Gatling Enterprise Edition account with private locations that can connect to the Dynatrace network.
Install the Dynatrace integration
The Dynatrace integration requires installation steps in your Dynatrace account and on your private locations control plane.
-
See the official Dynatrace API key documentation for creating an API key in your Dynatrace account. Ensure your API key has the following permissions:
- Ingest metrics (
metrics.ingest) - Ingest events (
events.ingest)
- Ingest metrics (
-
Identify your Dynatrace site identifier from your Dynatrace URL. For example, if your Dynatrace environment URL is
https://abc12345.apps.dynatrace.com, your environment ID isabc12345. -
In your control-plane configuration, in the section
system-properties, add:control-plane { locations = [ { system-properties { "gatling.enterprise.dt.api.key" = "<your Dynatrace api key>" "gatling.enterprise.dt.site" = "<your Dynatrace site identifier>" "gatling.enterprise.dt.useProxy" = "<true to use the same proxy as for the Gatling API>" # optional, default is false } } ] }
Uninstall the Dynatrace integration
To remove the link between Gatling Enterprise Edition and Dynatrace, remove the lines containing gatling.enterprise.dt in your control-plane configuration.
Events pushed to Dynatrace
Gatling Enterprise Edition generates custom information events for load test injection start and end.
All events are of type CUSTOM_INFO with the following properties:
| Property name | Description |
|---|---|
source |
Source reference for Gatling Enterprise events |
team |
Name of the team that owns the test |
phase |
Phase of the injection (start or end) |
test |
Test name |
run_id |
ID of the run |
See the official Dynatrace documentation for exploring events.
Metrics pushed to Dynatrace
Default dimensions
All metrics Gatling Enterprise Edition pushes to Dynatrace use the following dimensions:
| Dimension | Description |
|---|---|
team |
Name of the team that owns the test |
test |
Test name |
load_generator |
Load generator reference integer starting with 0 |
run_id |
ID of the run |
Available metrics
Gatling Enterprise Edition pushes the following list of load test metrics to Dynatrace:
| Metric | Type | Specific Dimensions |
|---|---|---|
gatling_enterprise.user.start_countgatling_enterprise.user.end_count |
count | scenario |
gatling_enterprise.user.concurrent |
gauge | scenario |
gatling_enterprise.request.count |
count | scenario group request |
gatling_enterprise.response.count |
count | scenario group request status |
gatling_enterprise.response.response_time.meangatling_enterprise.response.response_time.mingatling_enterprise.response.response_time.p50gatling_enterprise.response.response_time.p95gatling_enterprise.response.response_time.p99gatling_enterprise.response.response_time.p999gatling_enterprise.response.response_time.max |
gauge | scenario group request status |
gatling_enterprise.response.code |
count | scenario group request code |
gatling_enterprise.group.count |
count | scenario group |
gatling_enterprise.group.duration.meangatling_enterprise.group.duration.mingatling_enterprise.group.duration.p50gatling_enterprise.group.duration.p95gatling_enterprise.group.duration.p99gatling_enterprise.group.duration.p999gatling_enterprise.group.duration.maxgatling_enterprise.group.cumulated.meangatling_enterprise.group.cumulated.mingatling_enterprise.group.cumulated.p50gatling_enterprise.group.cumulated.p95gatling_enterprise.group.cumulated.p99gatling_enterprise.group.cumulated.p999gatling_enterprise.group.cumulated.max |
gauge | scenario group status |
gatling_enterprise.dns.count |
count | hostname status |
gatling_enterprise.dns.time.meangatling_enterprise.dns.time.mingatling_enterprise.dns.time.p50gatling_enterprise.dns.time.p95gatling_enterprise.dns.time.p99gatling_enterprise.dns.time.p999gatling_enterprise.dns.time.max |
gauge | hostname status |
gatling_enterprise.tcp.open_countgatling_enterprise.tcp.close_countgatling_enterprise.bandwidth_usage.sentgatling_enterprise.bandwidth_usage.received |
count | remote |
gatling_enterprise.tcp.connection_countgatling_enterprise.tls.handshake_count |
count | remote status |
gatling_enterprise.tcp.connect_time.meangatling_enterprise.tcp.connect_time.mingatling_enterprise.tcp.connect_time.p50gatling_enterprise.tcp.connect_time.p95gatling_enterprise.tcp.connect_time.p99gatling_enterprise.tcp.connect_time.p999gatling_enterprise.tcp.connect_time.maxgatling_enterprise.tls.handshake_time.meangatling_enterprise.tls.handshake_time.mingatling_enterprise.tls.handshake_time.p50gatling_enterprise.tls.handshake_time.p95gatling_enterprise.tls.handshake_time.p99gatling_enterprise.tls.handshake_time.p999gatling_enterprise.tls.handshake_time.max |
gauge | remote status |
gatling_enterprise.tcp.state_count |
gauge | remote state |
gatling_enterprise.cpu.usergatling_enterprise.cpu.sysgatling_enterprise.mem.ram.maxgatling_enterprise.mem.ram.usedgatling_enterprise.mem.heap.maxgatling_enterprise.mem.heap.committedgatling_enterprise.mem.heap.used |
gauge |
See the official Dynatrace documentation for exploring metrics.
Custom dimensions
You can add custom dimensions by adding system properties, either at the control-plane level or in your test configuration (except for no-code tests):
gatling.enterprise.dt.dimensions.<custom_dimension> = <your value>
HTTP Request Integration
Using Gatling and Dynatrace to capture request attributes
Pass Gatling load test request attributes to Dynatrace using additional HTTP headers. Dynatrace can handle, extract, and tag information from incoming HTTP headers containing information such as:
- script name,
- test step name, and
- virtual user ID.
You can then filter your monitoring data based on the defined tags.
Configure Dynatrace extraction rules
You can use any HTTP headers or HTTP parameters to pass contextual information. To configure the extraction rules in Dynatrace reference the extraction rules documentation.
Add contextual information to headers
The header x-dynatrace-test is used in the following example with the following set of key/value pairs for the header:
| Acronym | Full Term | Description |
|---|---|---|
| VU | Virtual User ID | A unique identifier for the virtual user who sent the request. |
| SI | Source ID | Identifies the product that triggered the request (e.g., Gatling). |
| TSN | Test Step Name | Represents a logical test step within the load testing script (e.g., Login, Add to Cart). |
| LSN | Load Script Name | Name of the load testing script that groups test steps into a multistep transaction (e.g., Online Purchase). |
| LTN | Load Test Name | Uniquely identifies a test execution (e.g., 6h Load Test – June 25). |
| PC | Page Context | Provides information about the document loaded on the currently processed page. |
Defining a global signing function (example)
The idea here is to use sign on the HttpProtocol to define a global signing function to be applied on all generated requests.
private static final String Hostname;

static {
  try {
    Hostname = InetAddress.getLocalHost().getHostName();
  } catch (UnknownHostException e) {
    throw new ExceptionInInitializerError(e);
  }
}

// Source Id identifies the product that triggered the request
private static final String SI = "GATLING";

// The Load Test Name uniquely identifies a test execution
private final String LTN =
  getClass().getSimpleName() +
    "_" +
    LocalDateTime.now().format(DateTimeFormatter.ISO_LOCAL_DATE_TIME);

HttpProtocolBuilder httpProtocol = http
  .sign((request, session) -> {
    // Virtual User ID of the unique user who sent the request
    String VU = Hostname + "_" + session.scenario() + "_" + session.userId();

    // Test Step Name is a logical test step within your load testing script
    String TSN = request.getName();

    // Load Script Name - name of the load testing script.
    String LSN = session.scenario();

    // Page Context provides information about the document
    String PC = String.join(",", session.groups());

    request.getHeaders()
      .set(
        "x-dynaTrace",
        "VU=" + VU + ";SI=" + SI + ";TSN=" + TSN + ";LSN=" + LSN + ";LTN=" + LTN + ";PC=" + PC
      );

    return request;
});private val Hostname: String = InetAddress.getLocalHost().getHostName()
// Source Id identifies the product that triggered the request
private val SI = "GATLING"
// The Load Test Name uniquely identifies a test execution
private val LTN =
javaClass.simpleName +
"_" +
LocalDateTime.now().format(DateTimeFormatter.ISO_LOCAL_DATE_TIME)
val httpProtocol = http
.sign { request: Request, session: Session ->
// Virtual User ID of the unique user who sent the request
val VU = "${Hostname}_${session.scenario()}_${session.userId()}"
// Test Step Name is a logical test step within your load testing script
val TSN = request.name
// Load Script Name - name of the load testing script.
val LSN = session.scenario()
// Page Context provides information about the document
val PC = session.groups().joinToString(",")
request.headers["x-dynaTrace"] =
"VU=$VU;SI=$SI;TSN=$TSN;LSN=$LSN;LTN=$LTN;PC=$PC"
request
}private val Hostname = InetAddress.getLocalHost.getHostName
// Source Id identifies the product that triggered the request
private val SI = "GATLING"
// The Load Test Name uniquely identifies a test execution
private val LTN =
getClass.getSimpleName +
"_" +
LocalDateTime.now.format(DateTimeFormatter.ISO_LOCAL_DATE_TIME)
val httpProtocol = http
.sign { (request, session) =>
// Virtual User ID of the unique user who sent the request
val VU = s"${Hostname}_${session.scenario}_${session.userId}"
// Test Step Name is a logical test step within your load testing script
val TSN = request.getName
// Load Script Name - name of the load testing script.
val LSN = session.scenario
// Page Context provides information about the document
val PC = session.groups.mkString(",")
request.getHeaders.set(
"x-dynaTrace",
s"VU=$VU;SI=$SI;TSN=$TSN;LSN=$LSN;LTN=$LTN;PC=$PC"
)
request
}Distributed tracing
Gatling Enterprise Edition can export its requests as OpenTelemetry spans and correlate them with the traces your own application produces. See Distributed tracing.
Point gatling.enterprise.tracing.endpoint at your environment’s
OTLP API endpoint
with the /v1/traces path, and pass your access token through
gatling.enterprise.tracing.http.headers.