AI Run Summary
AI Run Summary analyzes your run results and breaks them down into plain-language insights so you can understand what happened and decide what to do next, without having to be a performance expert.
Overview
After running a load test, interpreting results takes time and expertise. A p99 latency spike might be a real regression or just noise. A slow response time might be expected under that load, or a sign something broke.
AI Run Summary removes that friction. With one click, it generates a plain-language summary of your run: what happened, what stands out, and what to look at next, without needing to be a performance expert to make sense of it.
How to use it
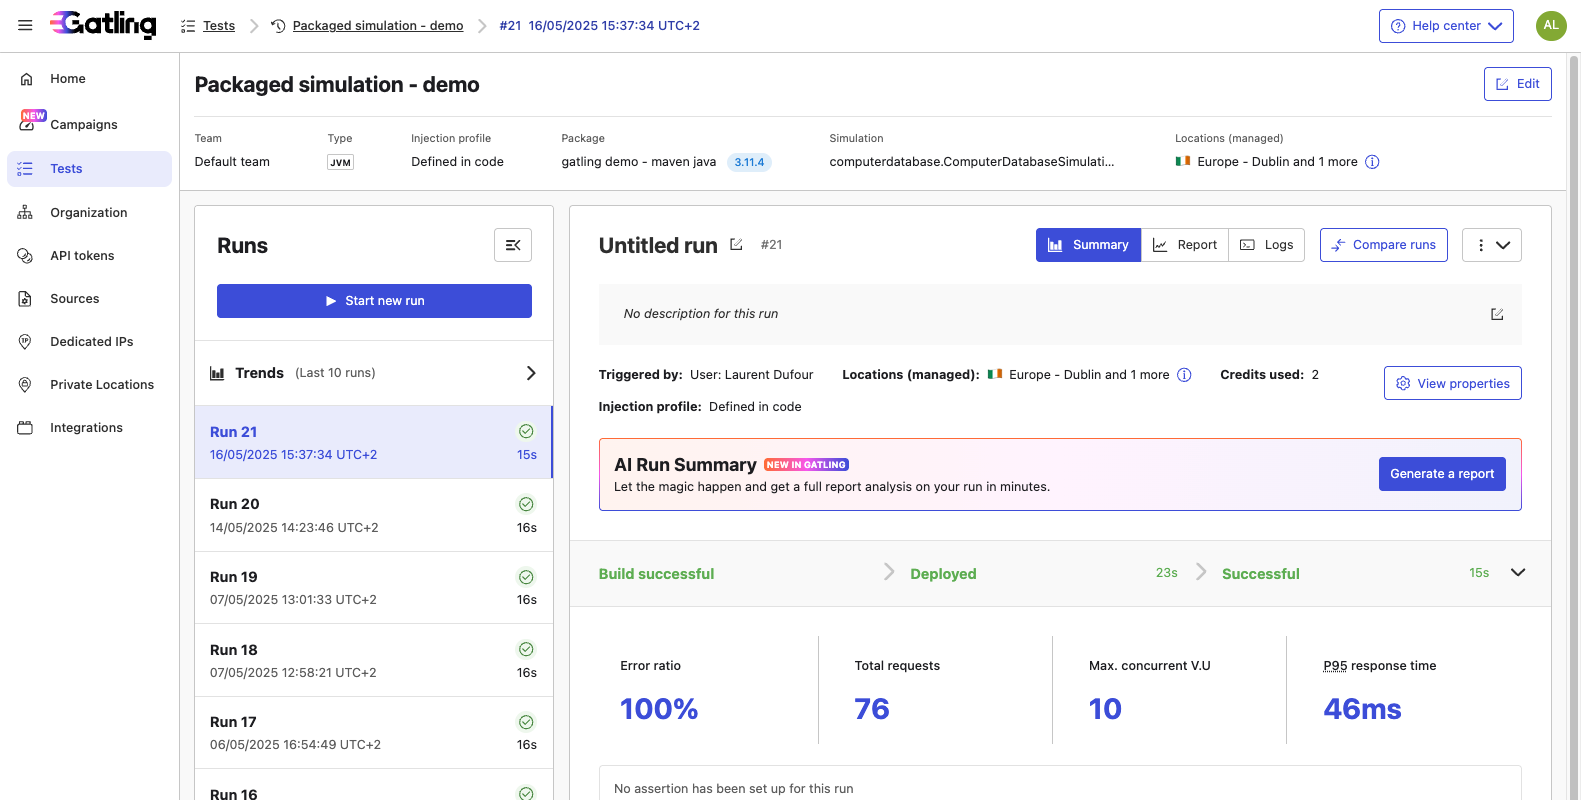
- Open a completed run details page from the Runs list.
- On the run results page, click the AI Run Summary button.
- The summary appears inline, no page reload, no separate view.
What you get
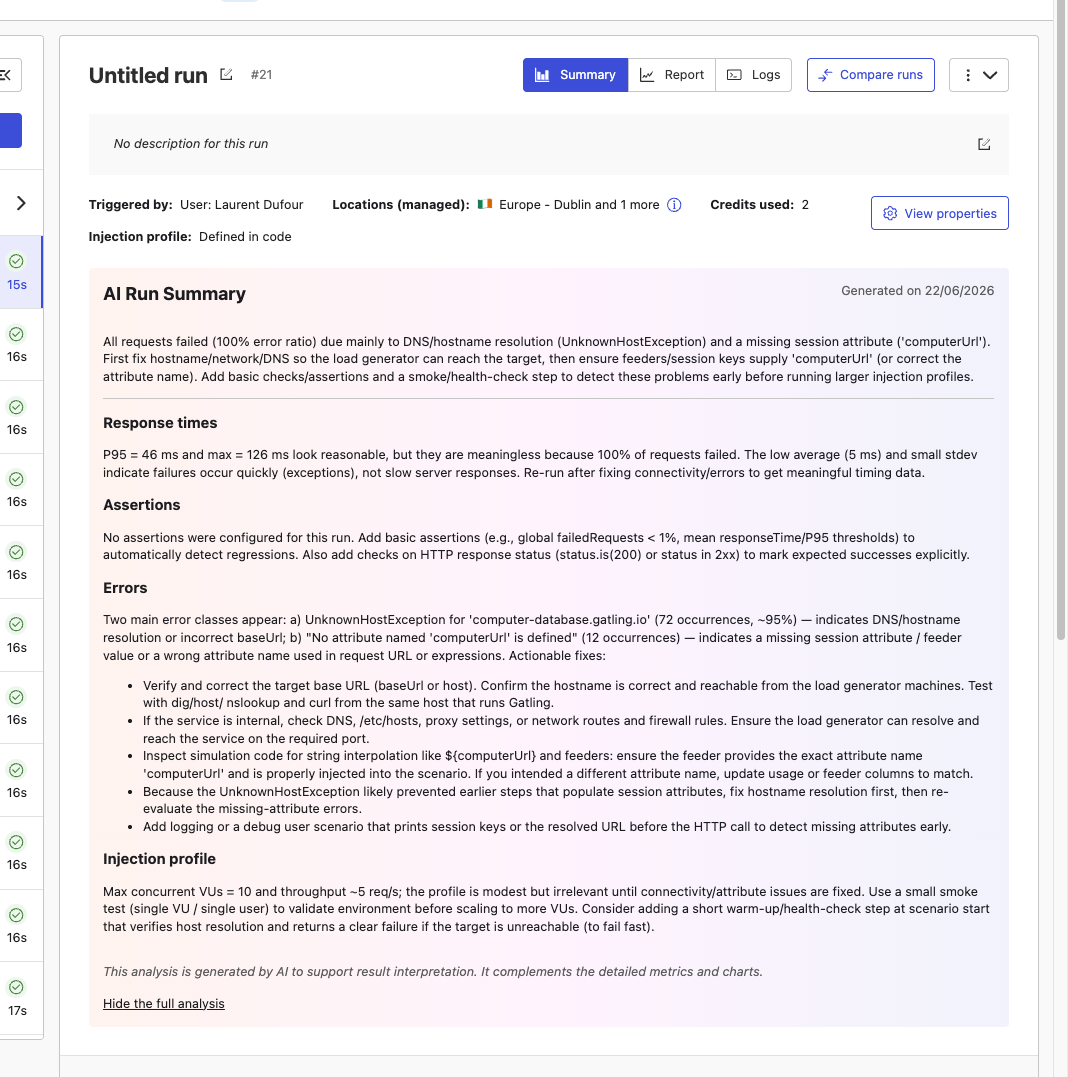
The summary is structured around two parts:
- Summary: a short, plain-language overview of the run results as a whole.
- Insights: a breakdown by area, when relevant data is available:
- Response times: analysis of latency distribution and percentiles
- Injection profile: whether the load was applied as intended
- Errors: observations on error rates, if any errors occurred
- Assertions: interpretation of assertion results, if assertions were defined
Insights are only shown for areas where data is present. If a run had no errors, the errors insight will be omitted.
Notes
- AI Run Summary is generated on demand, it is not computed automatically when a run completes.
- Each click generates a fresh summary. Results may vary slightly between runs on the same data.
- The summary is read-only and cannot be edited, but it can be copied and shared.