Run comparison
Compare run metrics to understand request-level changes in your application performance.
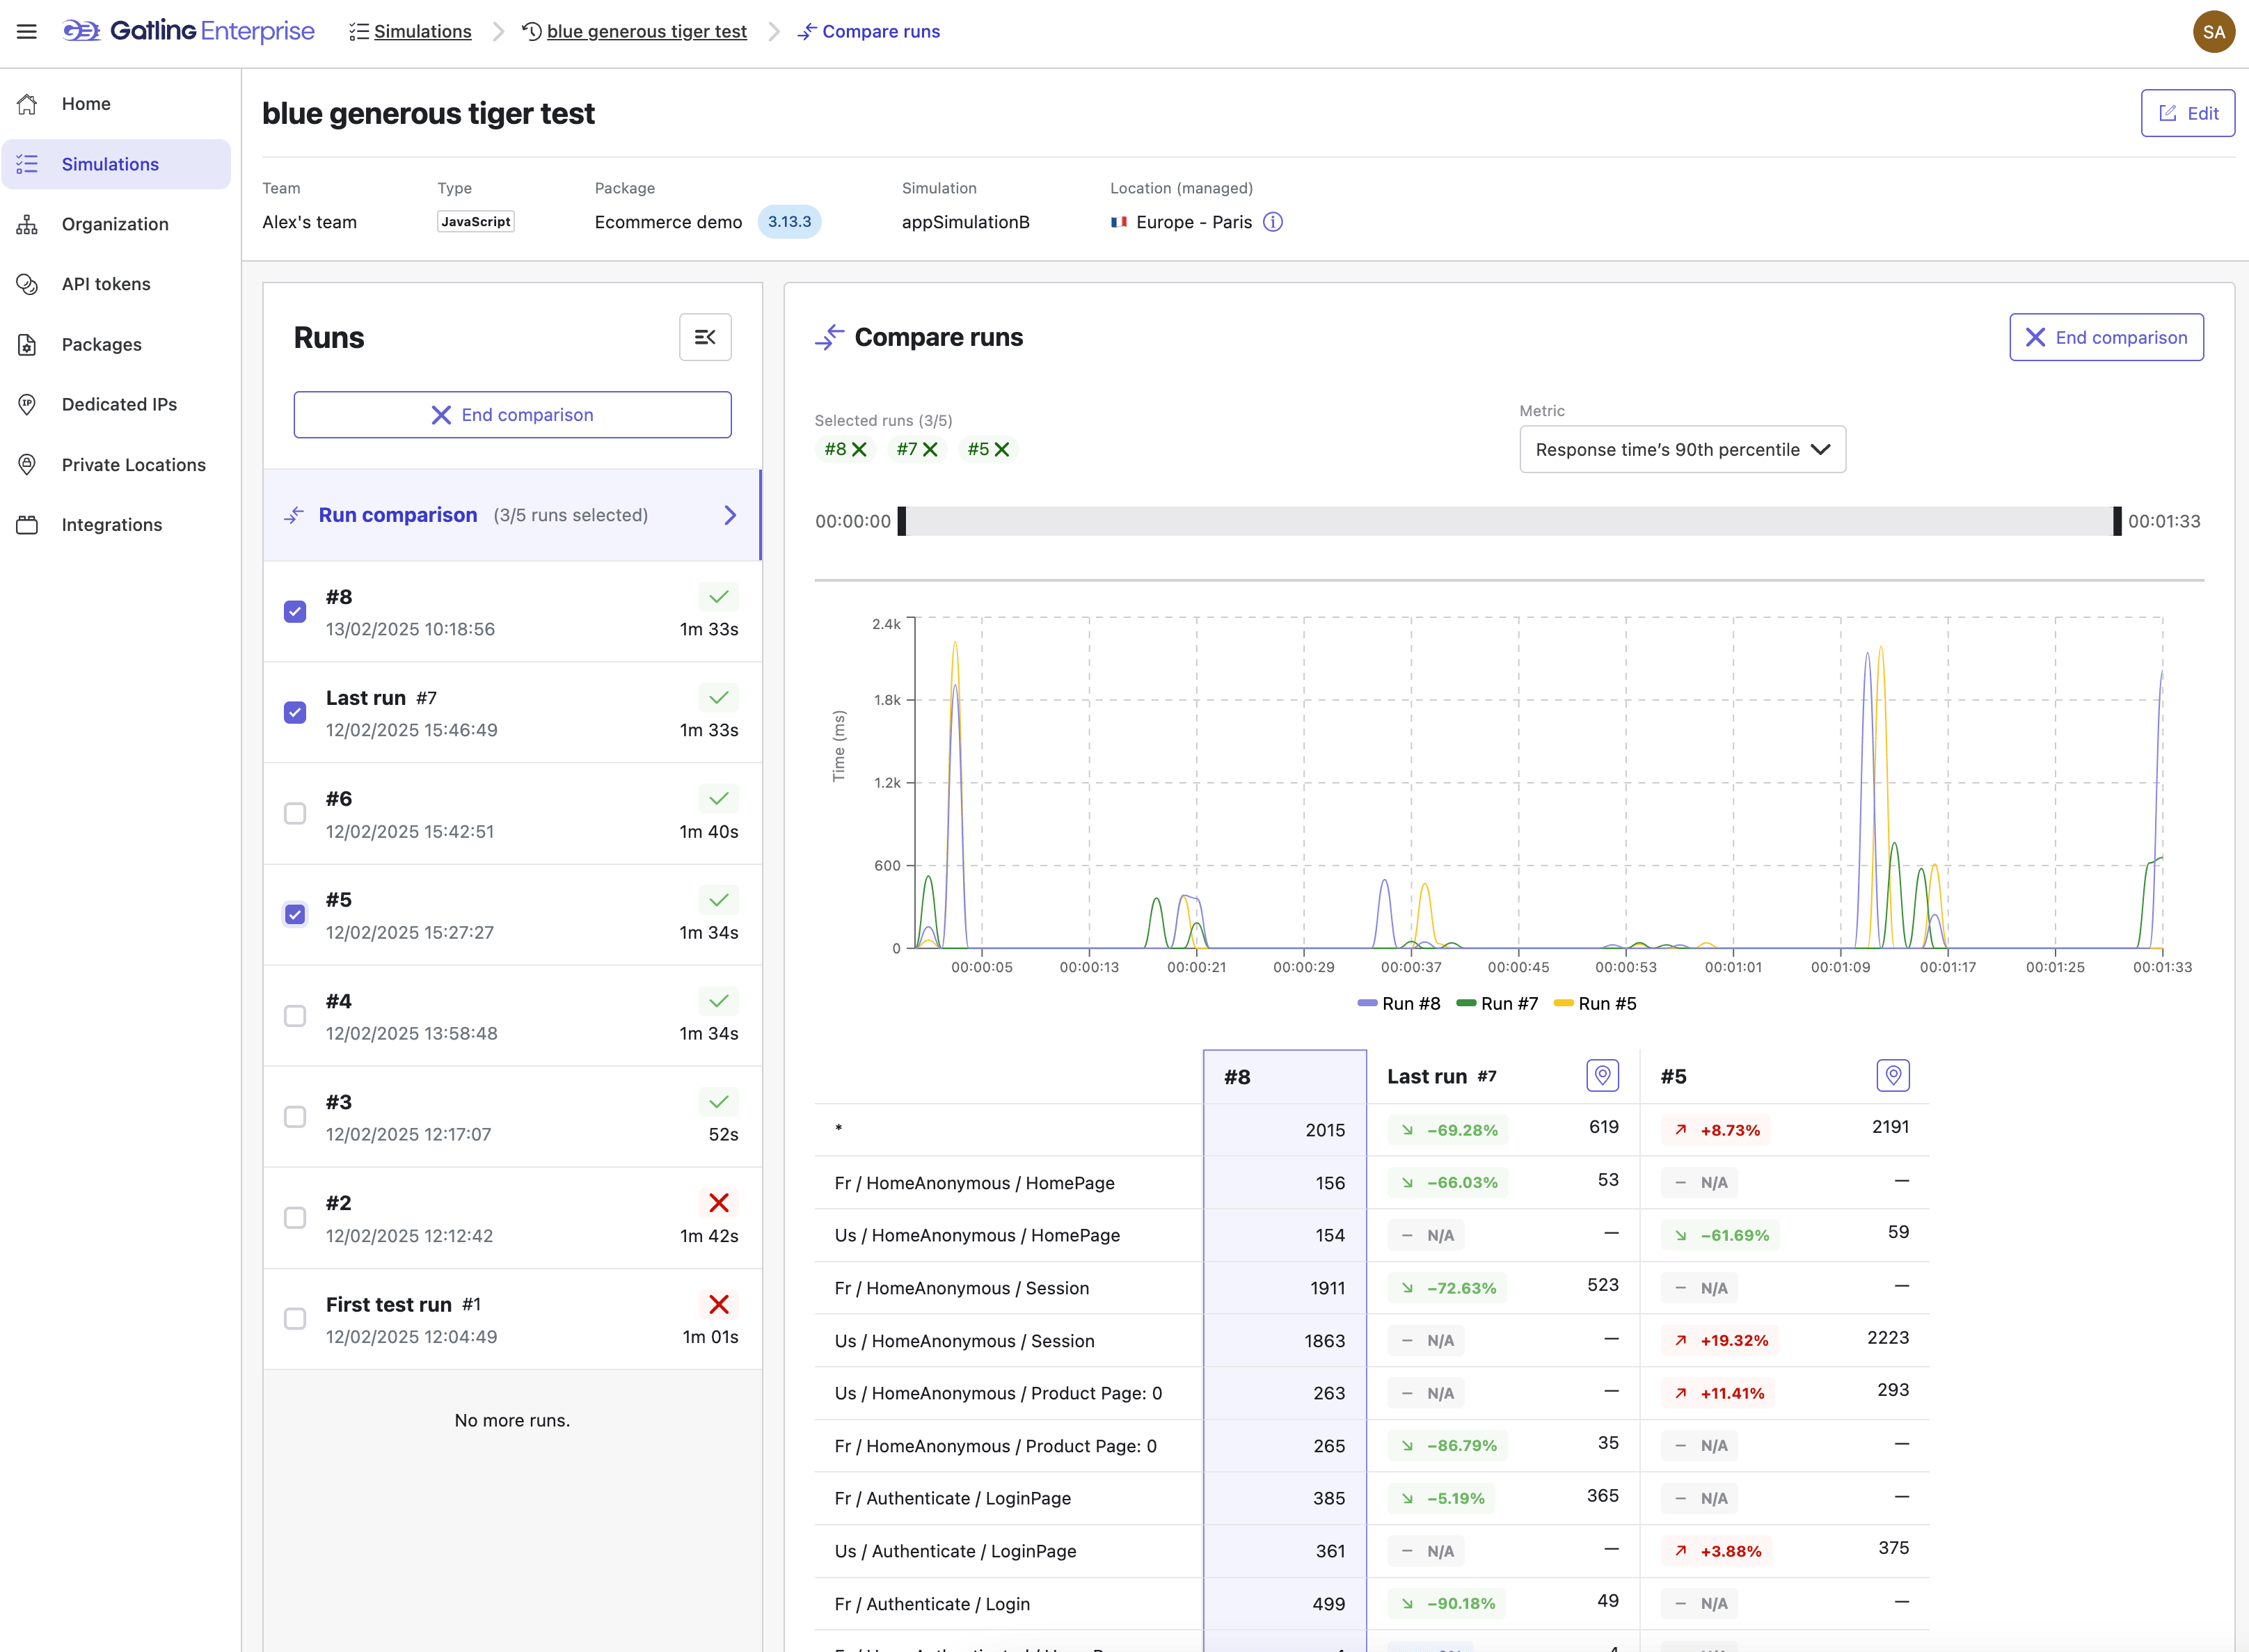
Select runs for comparison
Start a run comparison by clicking the Compare runs button, available from the simulation run trends page or on the individual reports page for each run. Once you start the compare runs mode, select runs for comparison from the left-side menu. Select up to 5 runs for simultaneous comparison. To change the compared runs:
- De-select any runs you no longer want to compare by clicking the filled checkbox next to the run title in the left-side menu or clicking the X next to the run number under the heading Selected runs.
- Click the empty checkbox next to the run title in the left-side menu for the runs you want to compare, up to 5 runs in total.
Compare runs
To compare runs:
- select a metric for comparison,
- (optional) modify the analysis time window,
- (optional) set a reference run.
After the aforementioned steps, you can compare the runs graphically and in table format. Since the run comparison is completely interactive, you can iterate on the above steps to keep investigating your run performance.
Select a metric
Run comparison works by comparing a single performance metric across selected runs. The default metric is concurrent users. Use the dropdown menu in the Compare runs window to change the selected metric. The available metrics are:
- Concurrent users,
- CPU usage (load generator),
- Errors,
- Response time 50th percentile,
- Response time 90th percentile,
- Response time 99th percentile,
- Response time 95th percentile,
- Response time 99.9th percentile,
- Response time 99.99th percentile,
- Response time maximum,
- Throughput (requests per second).
Once a metric is changed, the chart and table are dynamically updated to display the desired content.
Modify the analysis time window
The time period for run comparison can be altered to focus on a specific time window or incorporate the entire run. The default state is for the entire run duration to be compared. Actions for altering the analysis time window include:
- Shorten the time window by dragging the left and right sliders to the desired area.
- Lengthen the time window by dragging the left and right sliders to the desired area.
- Highlight the desired time window by using drag and drop on the chart itself
- Reset the time window to the entire run by double-clicking anywhere on the graph.
Set the reference run
The run comparison table shows the selected metric for each run along with a percent deviation from the reference run. By default, the first selected run is designated as the reference run and displayed in the left column. You can change the reference run by clicking the pin icon next to one of the other runs. This action moves the selected run to the left column and designates it as the reference run. The reported percent deviations are now based on the newly selected reference run.