Introduction to run trends and comparison
Get an overview of what run trends and comparison does and how to access the feature in Gatling Enterprise.
This feature is only available on Gatling Enterprise. To learn more, explore our plans
Run trends and comparisons allow you to investigate how your application performance changes over time. While anyone can use the feature, it is particularly powerful when load testing is integrated into your CI/CD workflows. The feature is split into 2 functionalities:
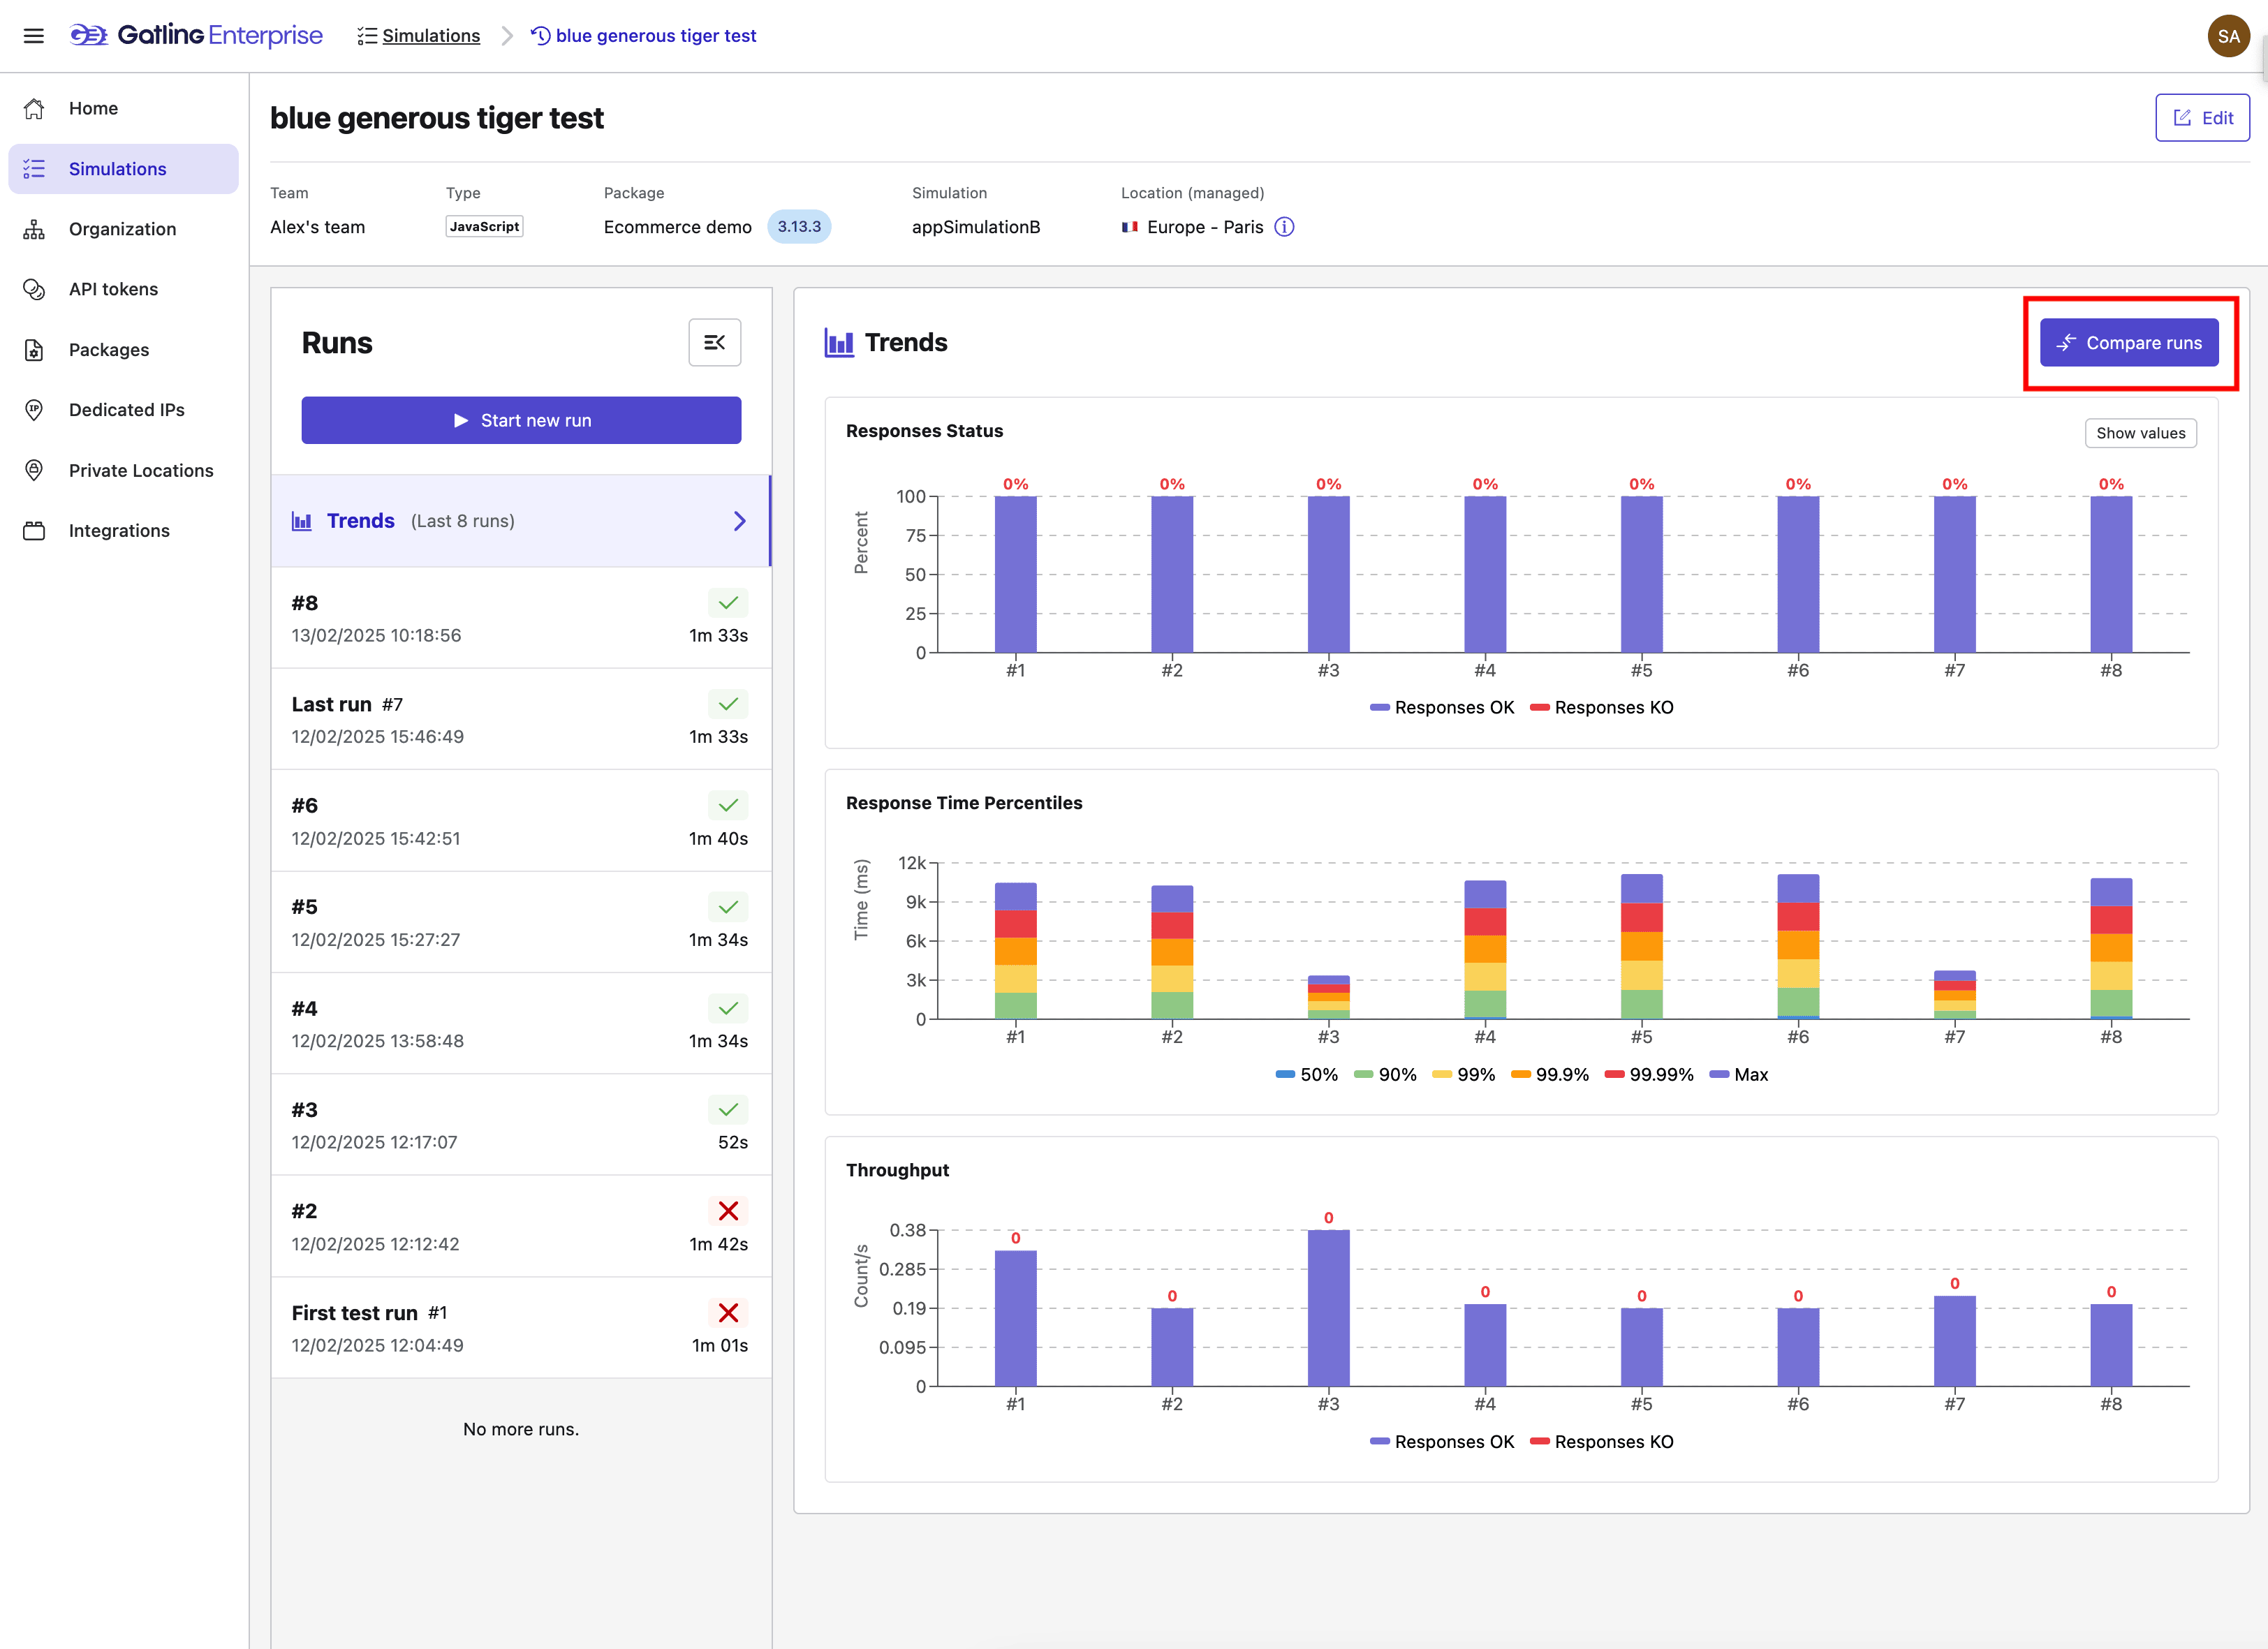
- Run trends gives you a high-level overview of your test performance covering your recent runs and displays up to 10 runs in total. Bar graphs illustrate:
- Response status
- Response time percentiles
- Throughput
- Run comparison allows you to create a custom, detailed comparison for up to 5 runs covering 11 different metrics. Comparisons are available in graphical and table format and the sampled time window can be modified on the fly.
Accessing run trends and comparison
Access run trends by selecting a simulation from the simulation table by clicking on the simulation name.
Access Run comparison by clicking the Compare runs button, which is available from the Run trends page, highlighted by the red square in the following image, and on the reports page for each individual run.