Understanding load tests with Gatling Enterprise Edition's advanced reporting features
Understanding load tests with Gatling Enterprise Edition's advanced reporting features
Introduction
Gatling Enterprise Edition has many reporting features that make analyzing a single load test or a time series of tests faster and easier. Our reporting is designed for collaboration across your organization. The following guide gives you an overview of each reporting feature and how to use it to improve your testing.
Community Edition vs. Enterprise Edition reporting
Gatling Community Edition reports while powerful and a great start are stored in separate HTML files. For Gatling Enterprise Edition one of the first and most important changes is how reports are kept. In order to compare two reports with Gatling Community Edition you need to open two reports separately and compare the results manually. However, with Gatling Enterprise Edition you can directly and quickly compare any two reports with the click of a button.
Run trends and comparison
When you upload a script to Gatling Enterprise Edition and set up a simulation it is saved for you in your simulation dashboard. Part of a great load testing strategy is to run the same set of simulations time after time as you make changes and your application evolves to make sure it’s still reacting well to the traffic you’re expecting. By using Gatling Enterprise Edition’s Run History you can get a quick snapshot of how your changes have affected your application or do a more detailed dive into the difference in response times and error rates in each request in your simulation.
Comparing runs
Once you enter your Run History for a simulation you’ll be able to see and access each report for each run.
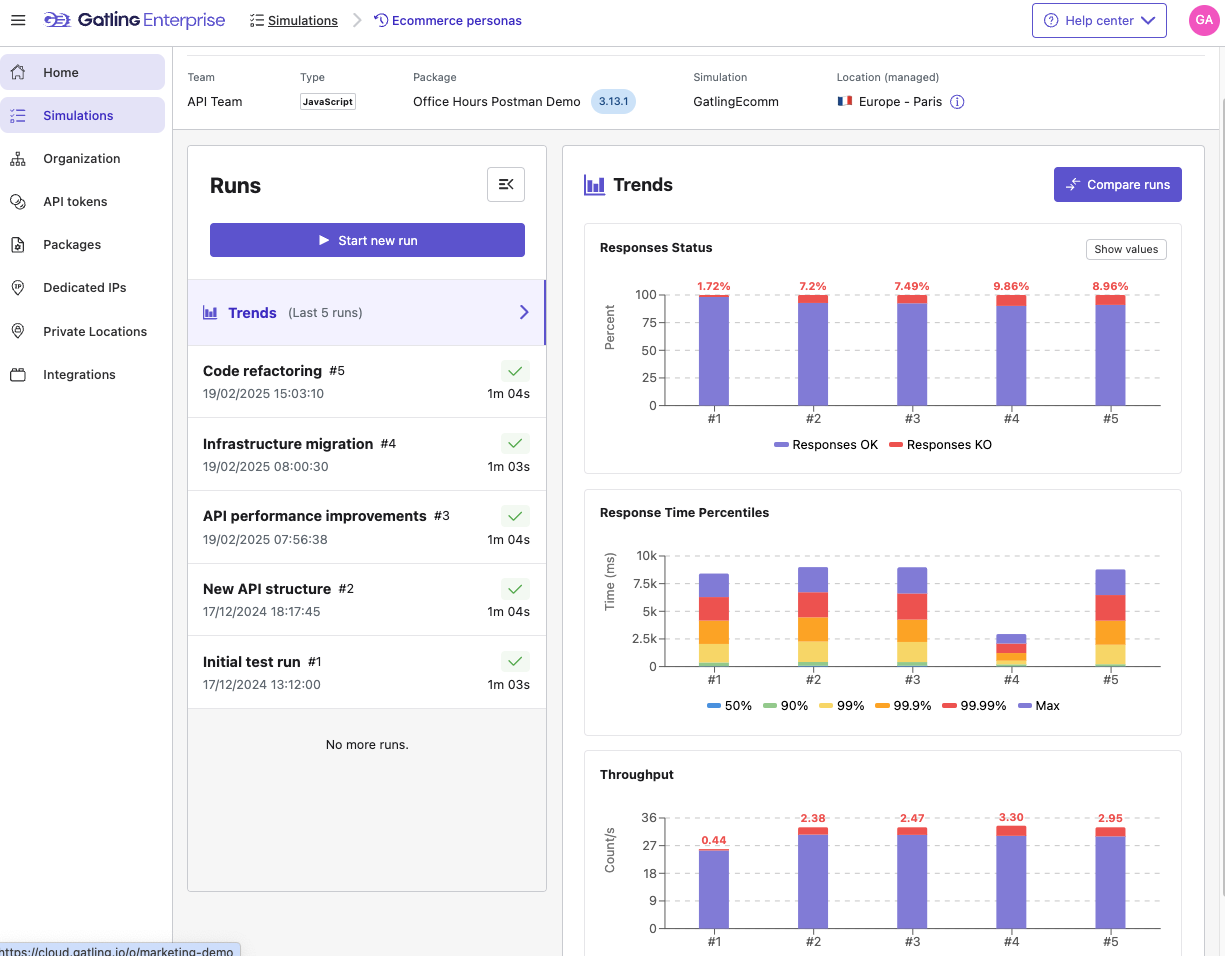
On the Run History page for a simulation, you also get access to 3 Trends graphs that give you a quick snapshot of the Requests and Responses, Response Time Percentiles, and Throughput over the history of a test you’ve run.
This allows you a simple way to see the results of your changes, especially if you’re using Gatling Enterprise Edition in your CI/CD process.
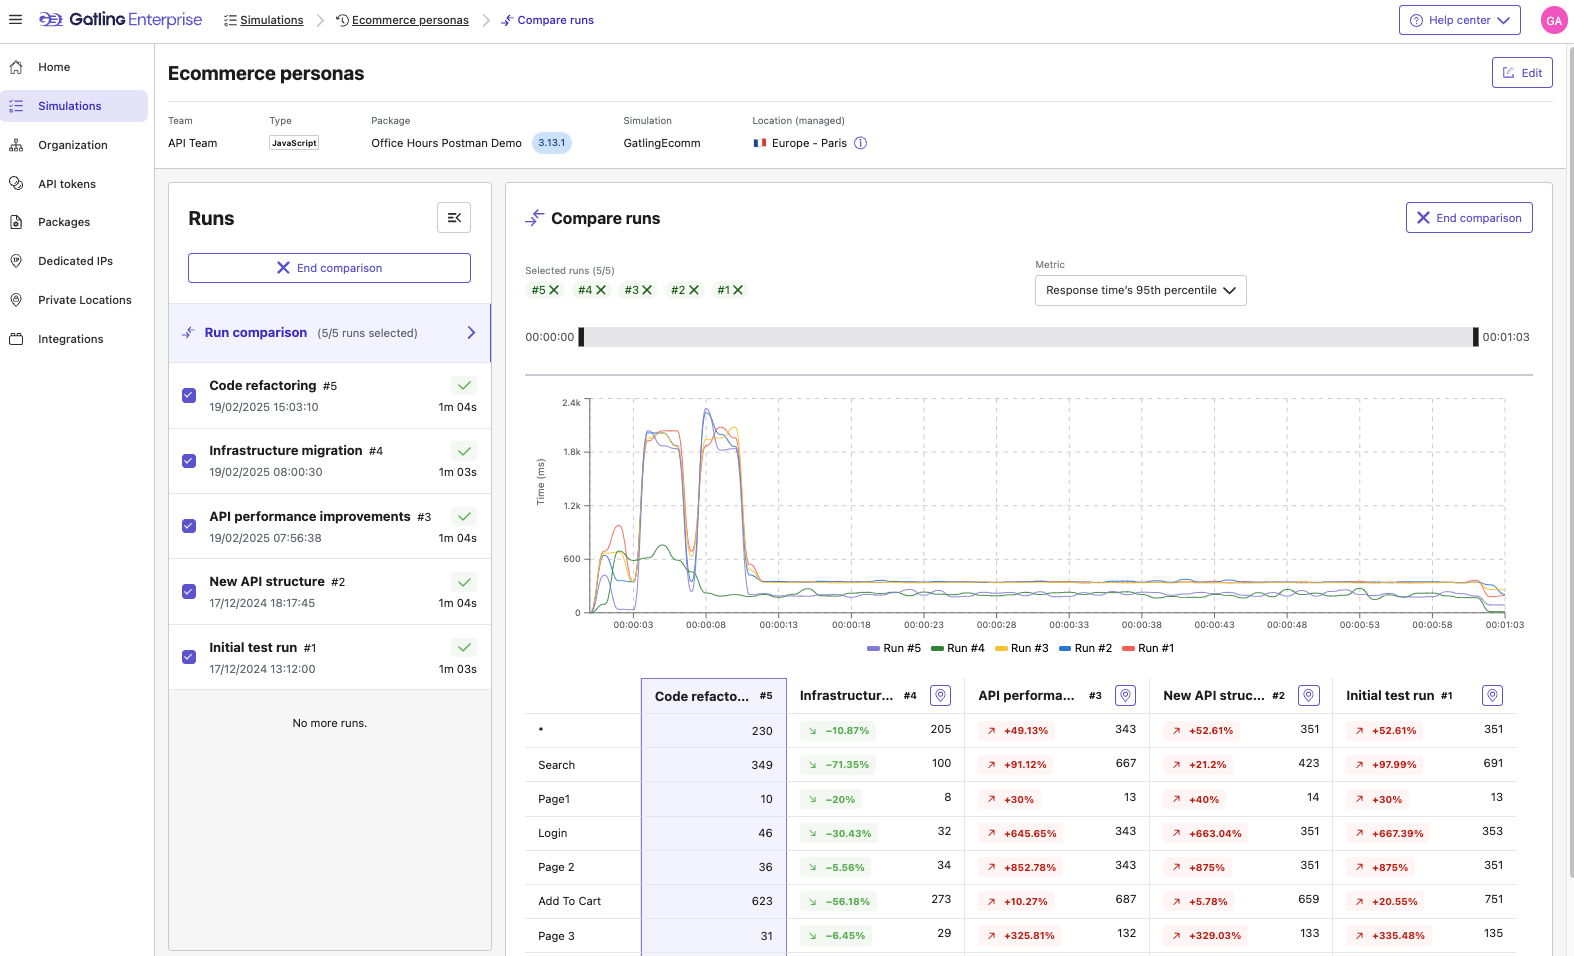
If you’d like to make a comparison between runs click the “Compare” button, which launches the multiple run, interactive comparison mode.
How is this helpful?
You can view your application’s general performance over a long period of time easily or do a quick comparison to see if any changes you’ve made between runs have caused any improvements or regression in terms of performance. That’s a quick overview of our Run History and Trends for Gatling Enterprise Edition.
Let’s get into the full reports now.
Gatling Enterprise Edition’s reports in detail
Filtering, sharing, and collaboration
As mentioned before Gatling Community Edition reports are static html files that can’t be changed or modified. Gatling Enterprise Edition reports are designed for collaboration.
To start with you have your run bar:
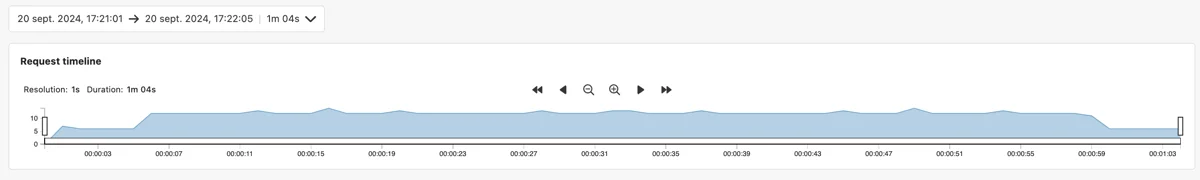
You can use the run bar to focus on specific sections of your simulation results. You can also collaborate with teammates by creating and sharing a public link, exporting to a PDF, or having Gatling Users in your organization leave comments on specific sections of a report.
How is this helpful?
This allows you to work with a full set of team members collaboratively on your load testing and also to get specific about which areas of your simulation you’d like to highlight.
All about the report tabs
We’re now going to dive into the tabs of a report and give you a little more information about each one, what they do, and how it can be helpful for you.
The Requests tab
The requests tab in Gatling Enterprise Edition allows you to see the response times and error ratios for each individual request. In the default view you also can get global overviews of your errors per second, responses per second (with status), response time distributions, and response time percentile distributions:
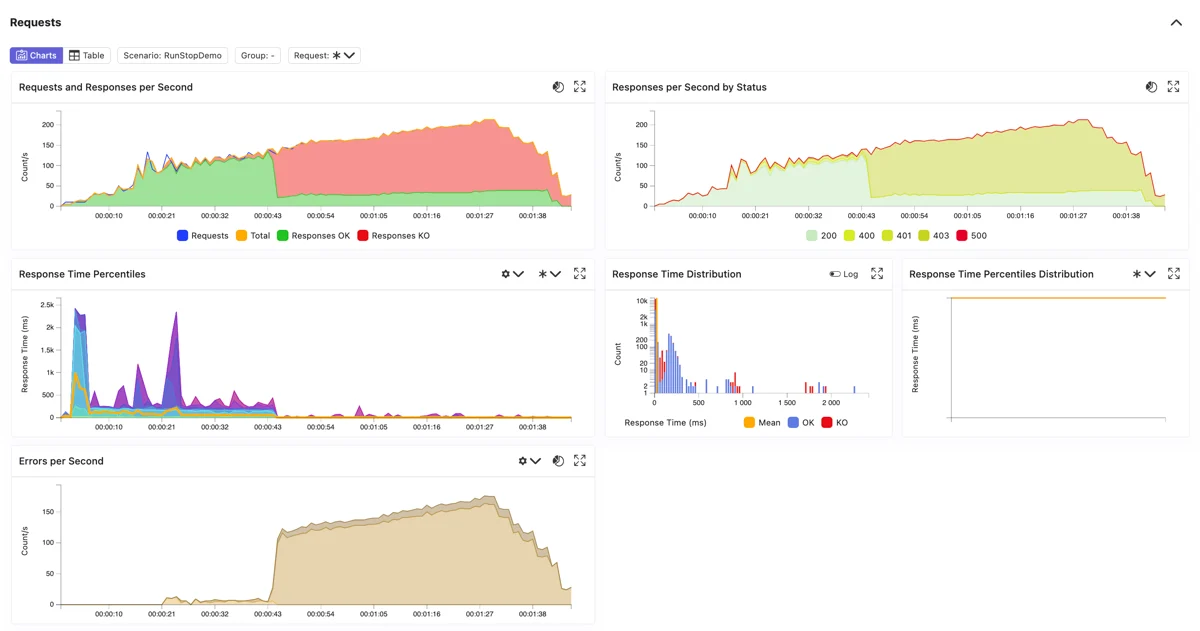
If you’d like a closer look at individual requests you can switch from the chart view to the summary view to get a look at the response times and error ratios for individual requests.
How is this helpful?
That should be pretty obvious. This is where you can see the performance of your application based on the scenario you’ve created. You can look at your overall performance to see where you might be experiencing issues or drill into individual requests to see what might be causing a bottleneck in terms of performance.
The Groups Tab
When designing a scenario, you can create a group of requests to organize and model processes on a page. You can even nest your groups to get a little more organized. Here’s a look at how to create a group in your scenario using our Java SDK:
group("foo").on(
 exec(http("name").get("/"))
);
So, if you’ve created any groups in your scenario the Groups tab will give you the same information as the Requests tab but the results will be based on the groups of requests you’ve designated rather than individual requests.
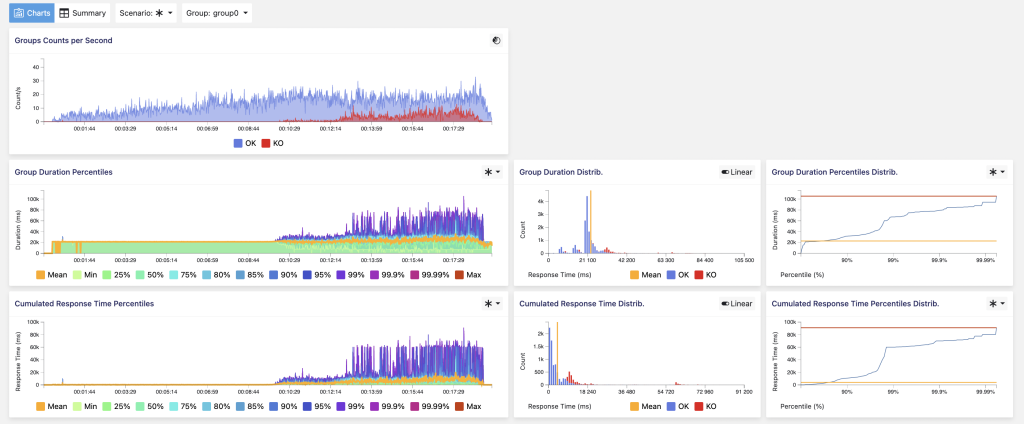
As with the requests tab you can switch to a summary view as well to view response times and error ratios based on the group.
How is this helpful?
The groups tab helps you organize your requests and lets you see if specific processes will experience any issues under load when running your tests.
The Users tab
Load testing is all about seeing how your application reacts to traffic or simulated users. The “Users” tab lets you see how many users you have arriving, leaving (terminating), and at a given time (concurrently) in your simulation.
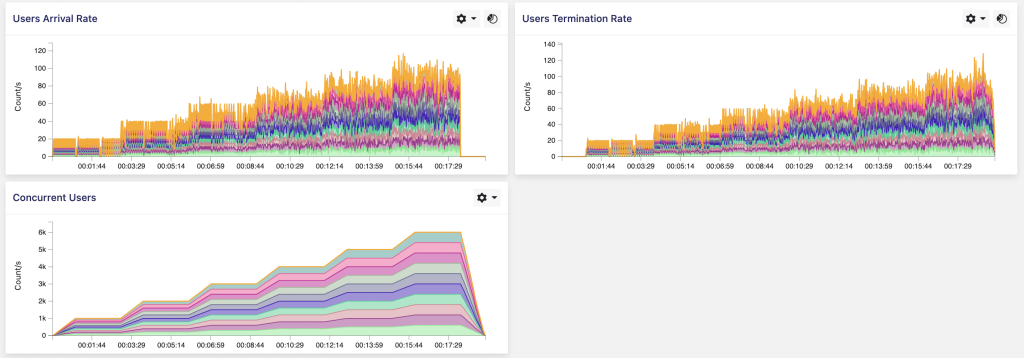
How is this helpful?
On its own, it’s a great way to visualize the users arriving in your test. In terms of testing though you can use it in conjunction with your requests page and the run bar to see what number of users is starting to cause problems in your application. By right-clicking anywhere on a chart you can add a marker that will carry across all charts. As an example below I have added a marker on the response time chart when load times start spiking so I can see on the “Users” tab how many concurrent users I have when the issues begin.
The Connections tab
Here, you can find information about the transport layer of your simulation. This tab is full of tons of data including connection open and closing rates, information about the TCP connections, and the TLS handshakes:
- 0 TCP Connections: used as the transport layer of the HTTP/1.1 and HTTP/2 protocols, this metric represents the time it takes for a server to acknowledge new clients so they can start sending data.
- TLS Handshake: if using HTTPS, we also measure the time it takes for the server and client to perform a verification handshake after opening the connection.
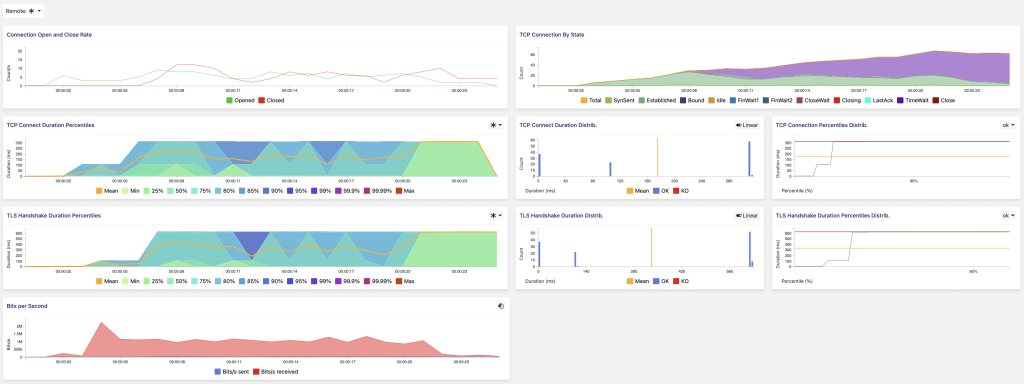
How is this helpful?
Looking at the connections and their open and closing rates allows you to see if the test is running as expected. Looking at the TLS handshakes can help to see if the encryption process is a bottleneck in the response time of your website or application. TCP connections can help you understand the traffic that is coming to your application and help show you if accepting new clients on your application is working successfully or causing unwanted issues.
The “DNS” tab
The DNS tab is incredibly helpful in determining, you guessed it, everything you need to know about the DNS for your website or application. Gatling Enterprise Edition gives you the option of examining the DNS resolutions per second, DNS percentiles, DNS duration distribution, and percentiles for each hostname your website or application is using.
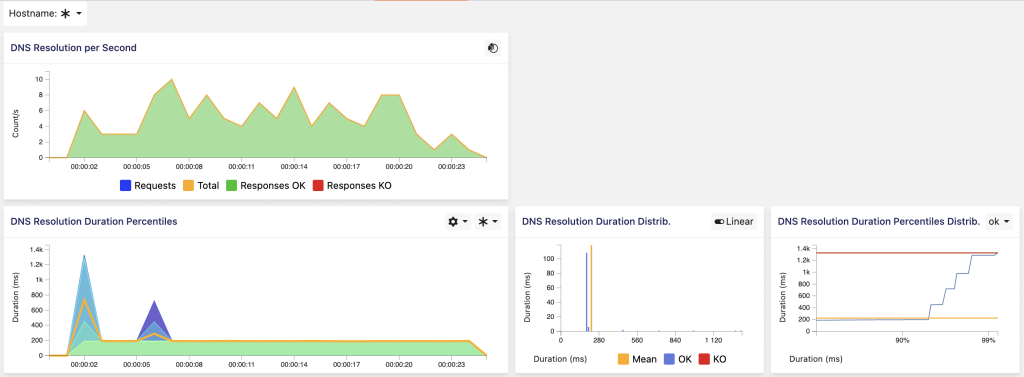
How is this helpful?
If you’re using a custom DNS you can use the information in the DNS tab to answer the below questions:
- Is my DNS resolution fast enough?
- Is my first DNS query for my website too slow?
- Do I need DNS servers closer to my customers?
- Are the queries cached properly?
By answering these questions you can correctly configure your DNS in the best way to serve your clients faster and more efficiently.
The Load Generators tab
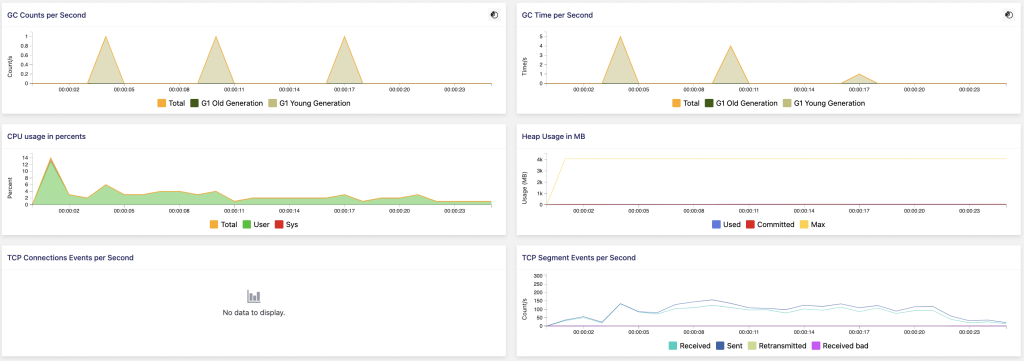
In the load generators tab, you can see how much of each load generator you use. You’ll generally notice a spike in the CPU usage at the start of your simulation, this is the JVM warming up. Afterward, you’ll see how much load generator power you use to run your simulation.
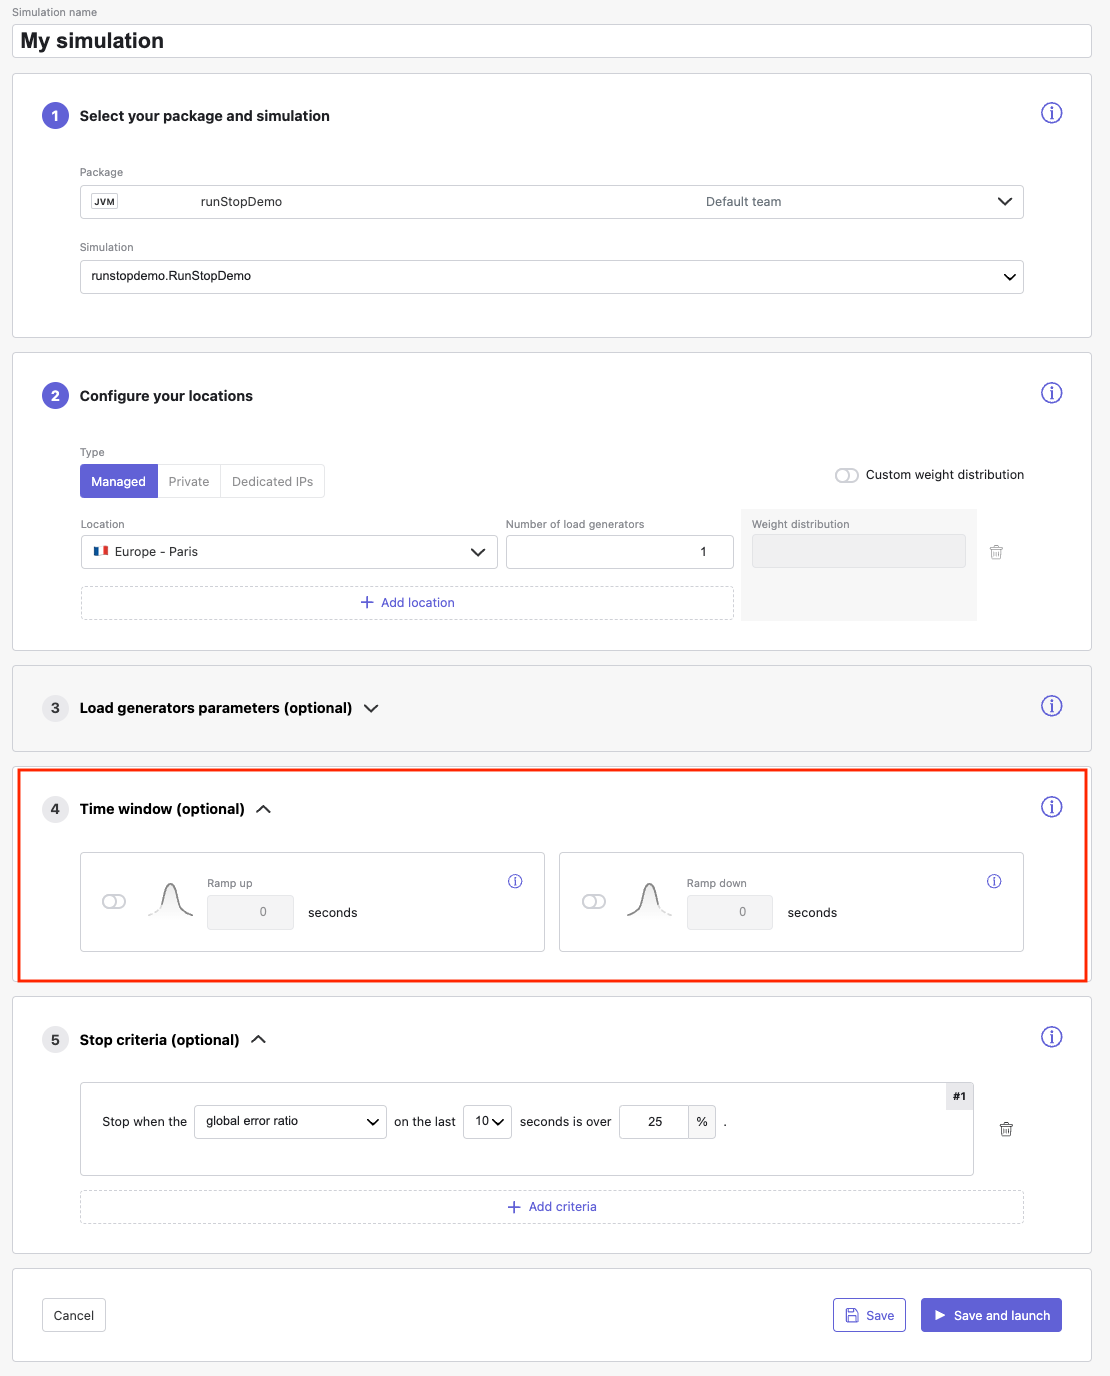
When creating or editing your simulation on Gatling Enterprise Edition you can go to the “Time Window” screen and set a ramp-up and ramp-down time to make your simulation cleaner and more accurate as both your application and Gatling’s load generators may need some warm-up time.
Once you’ve done this you can get a good idea of how many virtual users you can have in your simulation using the load generators you’ve selected and reconfigure your script to add more if you choose to.
When discussing Gatling Enterprise Edition the most common question we’re asked is “How many virtual users can I generate with one load generator?” The answer from our end is “It depends on the scenario you’re trying to test. The theoretical limit is 35,000 - 40,000 users can be generated with one load generator or 300,000 requests per second. But, it depends on your scenario and the requests and API calls it contains. By using the load generators tab you can determine how much you’re stressing the load generator and get a real expectation of the load you’ll be able to generate for your specific scenario.
How is this helpful?
The load generators tab can let you know if performance issues in your simulation are a result of your application or whether you’re actually stressing the load generator too much with the load you’re trying to generate. You can also see how much load generator power you’re using and decide to add more users or load generators if necessary. This can help you choose your Gatling Enterprise Edition subscription based on how many load generators you’ll need and how many credits you’ll use in your testing as well.