Grafana Datasource for Gatling Enterprise Edition
Display Gatling Enterprise Edition simulation reports in Grafana.
Requirements
Download and install Grafana.
Grafana datasource installation
The Gatling Enterprise Edition datasource for Grafana is packaged as a ZIP bundle and can be downloaded by clicking on the following button:
You can install it using the grafana-cli:
grafana-cli --pluginUrl GRAFANA_DATASOURCE_BUNDLE_URL plugins install frontline
Please note that the plugin is unsigned so recent versions of Grafana may reject it by default. In this case, you have to add the plugin to the list of allowed unsigned plugin.
Please edit the existing line with allow_loading_unsigned_plugins in defaults.ini and add frontline to the comma-separated list, eg:
allow_loading_unsigned_plugins = frontline
Adding the datasource
- In the Grafana side menu you will find the
Data Sourceslink underConfiguration(link name may depend on the grafana version).
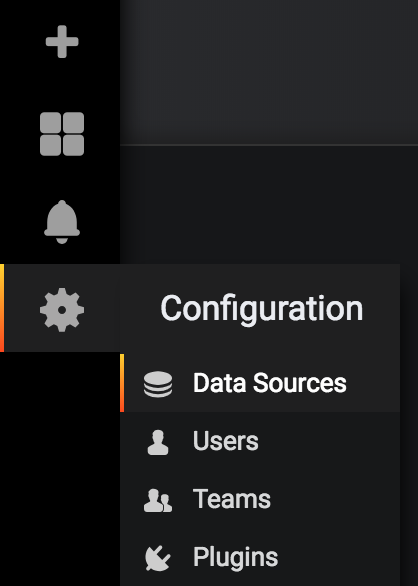
Admin role for the current organization.- Click the Add data source link in the top header.
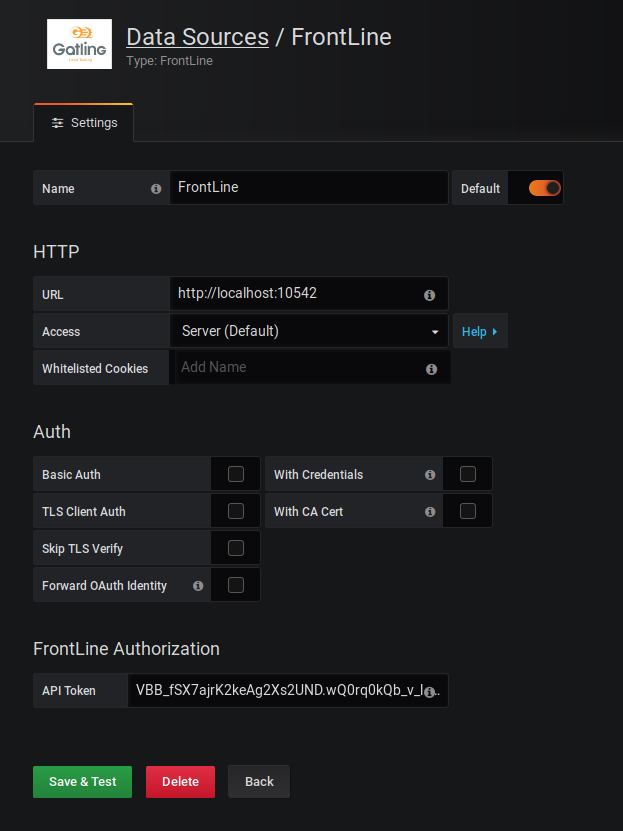
- Select Gatling Enterprise Edition.
| Name | Description |
|---|---|
| Name | The datasource name. Type Gatling Enterprise if you want to use our samples. |
| Default | Should be checked if you want that datasource to be selected by default in new panels. |
| URL | URL of your Gatling Enterprise Edition server. |
| Access | Server access via Grafana backend, Browser access directly from browser. |
| Auth | Gatling Enterprise Edition datasource ignore these fields. |
| API Token | API token needed to authenticate to Gatling Enterprise Edition. The API token needs the Read permission. |
Templating
dashboardSamples directory in your Grafana bundle.
They are built with a datasource named Gatling Enterprise. Make sure this datasource exists or modify the json file accordingly.To use the Gatling Enterprise Edition datasource in Grafana, you will need to set template variables.
These are global dashboard parameters that can be used in your graphs with the query builder.
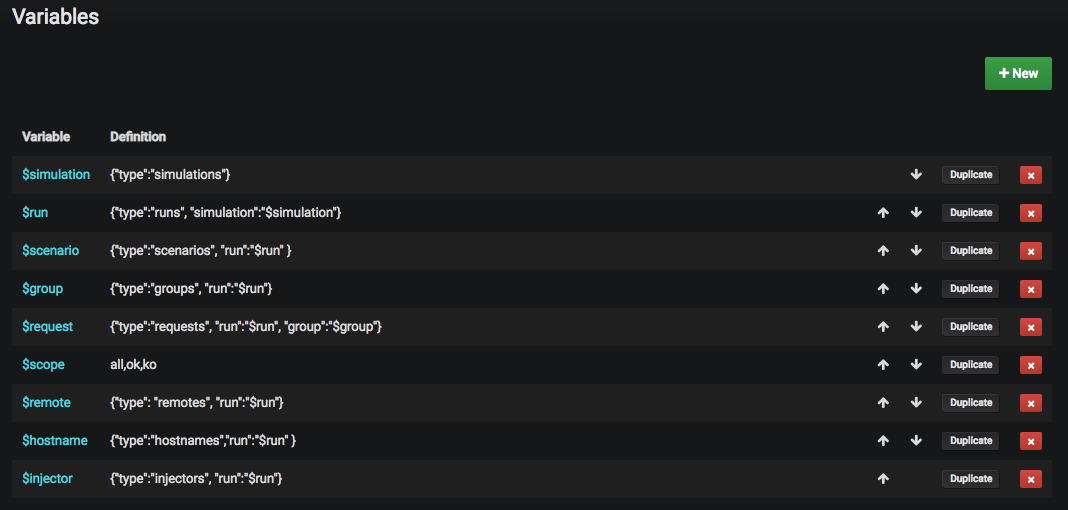
To create a variable on your dashboard, Click the settings button on the top right menu of the dashboard, go to the Variables tab and click on the + New button.
For example, to create the simulation template variable and use them in your graphs:
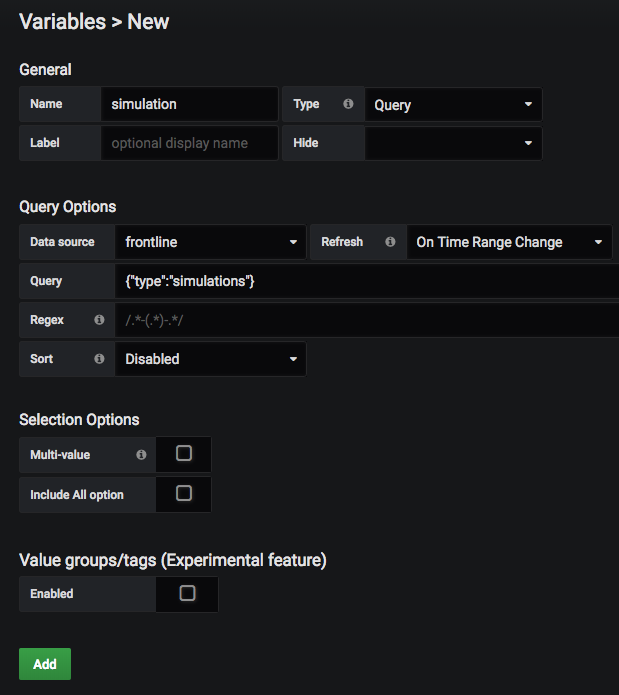
You will need for the scopes to use Custom type as shown below:
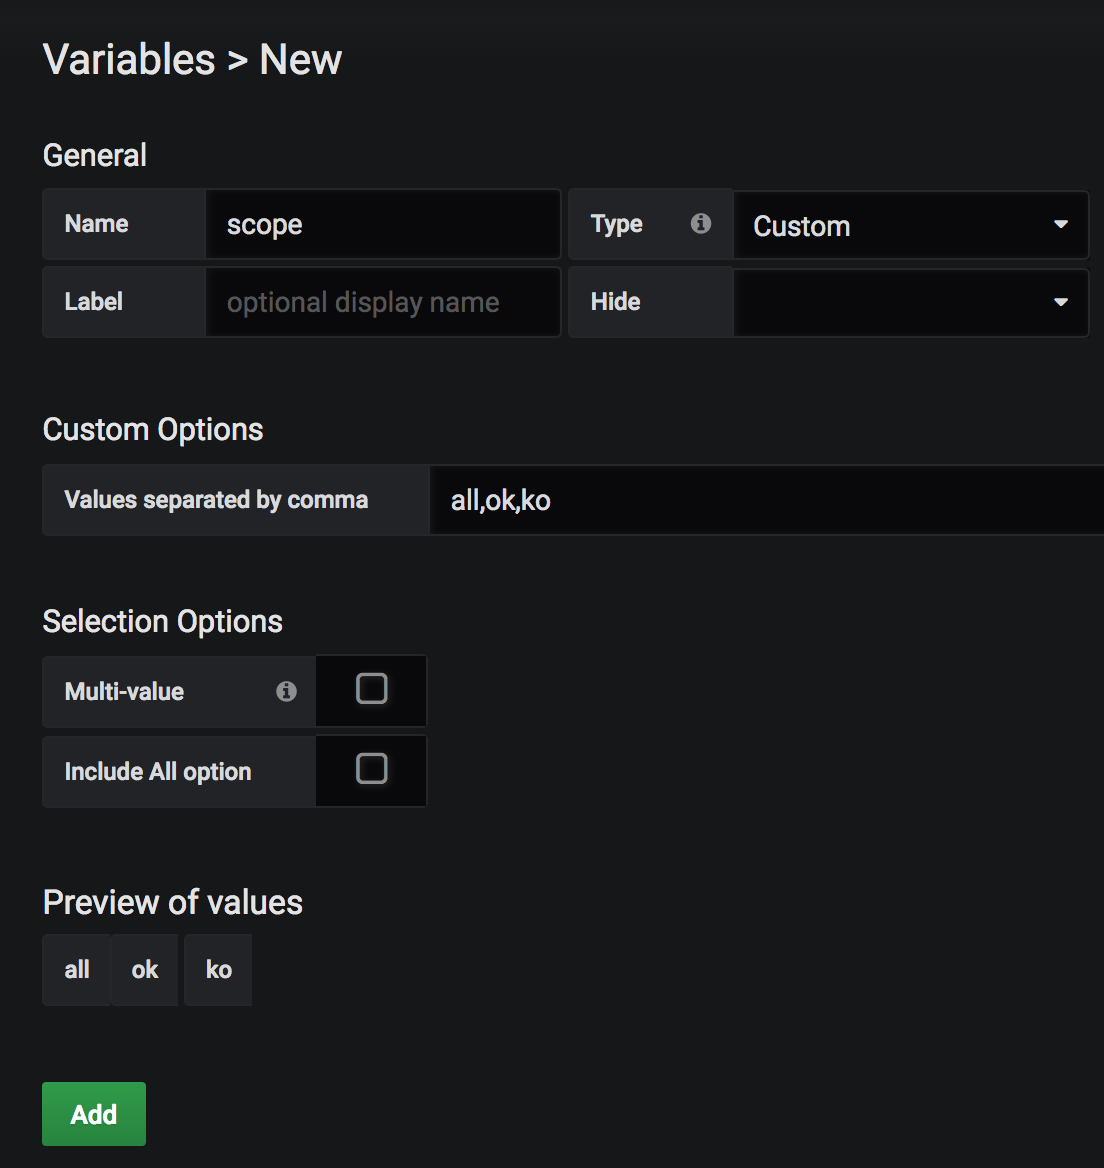
At the end, your template variables should be something like:

Gatling Enterprise Edition Metrics
Gatling Enterprise Edition offers a large amount of metrics:
- Requests metrics:
req.<Percentiles>: Response time percentiles metric.requests: Requests count per second.responsesOk: Responses OK count per second.responsesKo: Responses KO count per second.responsesByStatus: Requests count by status per second.errors: Errors count by error name per second.
- Group metrics:
groupCumulated.<Percentiles>: Group cumulated response time percentiles.groupDuration.<Percentiles>: Group duration percentiles metric.groupCountsOk: Group count OK per second.groupCountsKo: Group count KO per second.
- Users metrics:
usr+: Users arrival count per second.usr-: Users termination count per second.usrActive: Concurrent users count per second.
- Load Generators metrics:
gcCount: GC count per second.gcTime: GC time per second.heapUsed: Heap used in Mb.heapMax: Heap max in Mb.heapCommitted: Heap committed in Mb.tcpSeg: TCP events count per second.tcpConn: TCP connection events count per second.cpuSys: CPU system usage in percent.cpuUser: CPU user usage in percent.
- Connections metrics:
bitsSent: Bits sent per second.bitsReceived: Bits received per second.connectionOpened: Connection opened count per second.connectionClosed: Connection closed count per second.connectionTcpState: TCP connection count by state.tcp.<Percentiles>: TCP connect duration percentiles metric.tls.<Percentiles>: TLS handshake duration percentiles metric.
- DNS metrics:
dns.<Percentiles>: DNS resolution duration percentiles metric.
Metric Requirements
Part 1
| Metrics name | simulation | scenario | group | request |
|---|---|---|---|---|
req.<Percentiles> |
||||
requests |
||||
responsesOk |
||||
responsesKo |
||||
responsesByStatus |
||||
errors |
||||
groupCumulated.<Percentiles> |
||||
groupDuration.<Percentiles> |
||||
groupCountsOk |
||||
groupCountsKo |
||||
usr+ |
||||
usr- |
||||
usrActive |
||||
gcCount |
||||
gcTime |
||||
heapUsed |
||||
heapMax |
||||
heapCommitted |
||||
tcpSeg |
||||
tcpConn |
||||
cpuSys |
||||
cpuUser |
||||
bitsSent |
||||
bitsReceived |
||||
connectionOpened |
||||
connectionClosed |
||||
connectionTcpState |
||||
tcp.<Percentiles> |
||||
tls.<Percentiles> |
||||
dns.<Percentiles> |
Part 2
| Metrics name | remote | hostname | load generator | scope |
|---|---|---|---|---|
req.<Percentiles> |
||||
requests |
||||
responsesOk |
||||
responsesKo |
||||
responsesByStatus |
||||
errors |
||||
groupCumulated.<Percentiles> |
||||
groupDuration.<Percentiles> |
||||
groupCountsOk |
||||
groupCountsKo |
||||
usr+ |
||||
usr- |
||||
usrActive |
||||
gcCount |
||||
gcTime |
||||
heapUsed |
||||
heapMax |
||||
heapCommitted |
||||
tcpSeg |
||||
tcpConn |
||||
cpuSys |
||||
cpuUser |
||||
bitsSent |
||||
bitsReceived |
||||
connectionOpened |
||||
connectionClosed |
||||
connectionTcpState |
||||
tcp.<Percentiles> |
||||
tls.<Percentiles> |
||||
dns.<Percentiles> |

